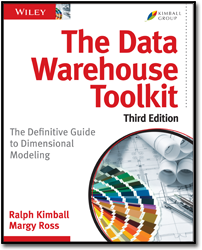
Ralph Kimball and Margy Ross co-authored The Data Warehouse Toolkit, Third Edition (Wiley, 2013). This definitive guide provides a complete collection of dimensional modeling techniques, beginning with fundamental concepts and gradually progressing through increasingly complex real-world case studies.
The book significantly enhances and expands upon the concepts and examples presented in the earlier editions of The Data Warehouse Toolkit.
- “Official” glossary of more than 80 Kimball dimensional modeling techniques
- Expanded coverage of advanced dimensional modeling patterns for more complex real-world scenarios, including bridge tables for ragged variable depth hierarchies and multivalued attributes
- Sample data warehouse bus matrices for 12 case studies
- Enhanced slowly changing dimension techniques type 0 through 7
- Recommended best practices for big data analytics
- Guidance regarding collaborative, interactive dimensional modeling design sessions with business stakeholders
- Updated overview of the Kimball DW/BI project lifecycle methodology
- Comprehensive review of extract, transformation, and load (ETL) systems and design considerations, including 34 subsystems and techniques to populate dimensional models
Tools and Utilities
NOTE: If your browser opens a file rather than downloading it, try right-clicking on the link and selecting “Save Target As.”
Chapter 3
Sample date dimension spreadsheet
Correction to Figure 3-13: The first heading in the lower report shown in Figure 3-13 should read “Calendar Week Ending Date,” just like the top report in that figure.
Correction to text at top of page 100 under Dimension Table Surrogate Keys heading: It has 32 bits and therefore can handle approximately 4 billion unsigned positive values (232) or 4 billion total positive and negative values (-231 to 231-1).
Chapter 4
Correction to text beneath Figure 4-3: The only fully additive metric in the figure is Quantity Sold. The Quantity on Hand and inventory valuation metrics are semi-additive as they can’t be simply summed over time periods; you would want to divide the sum by the number of daily observations to arrive at an average inventory balance or valuation.
Chapter 10
Correction to Figure 10-4: The Customer Key in the far right table of Figure 10-4 should be designated as a primary key (PK), not a foreign key (FK).


