The Kimball methodology of building a data warehouse is often called a bottom-up approach. This label, along with its associated connotations, is misleading, and misunderstandings about our approach are proliferating. It’s time to set the record straight: Although our iterative development and deployment techniques may superficially suggest a bottom-up methodology, a closer look reveals a broader enterprise perspective.
Focus on the Enterprise, Not Departments
The bottom-up terminology originated to distinguish the Kimball approach from other alternatives. Bottom-up is typically viewed as quick and dirty — focused on the needs of a single department rather than the enterprise.
But suggesting that Kimball dimensional models or data marts are built to serve the needs of a single department or workgroup is a gross misrepresentation. Unfortunately, this perception causes an enormous amount of confusion and consternation, in addition to spawning criticism regarding our techniques. Our dimensional models and data marts explicitly embrace an enterprise point of view.
For more than 20 years, we’ve been helping organizations publish their data assets to enable better strategic and tactical decision-making. Our focus on business requirements has remained steadfast. Unfortunately, a business-centric approach is sometimes seen as synonymous with building independent departmental or workgroup solutions. However, we provide very specific recommendations for avoiding that snake pit both in The Data Warehouse Toolkit and The Data Warehouse Lifecycle Toolkit. When gathering business requirements, we encourage you to broaden your perspective both vertically and horizontally.
Rather than solely relying on business data analysts to determine requirements, you should also meet with senior managers to better understand their vision, objectives, and challenges. Ignoring this vertical span leaves the data warehouse team vulnerable to here-and-now myopia — a failure to grasp the organization’s direction and likely future needs.
Keep in mind that you also need to look horizontally across the organization before designing a data warehouse’s dimensional presentation. This suggestion, although somewhat challenging to adopt if a single department is funding the project, is absolutely critical to establishing the enterprise view. Ignoring the horizontal span leaves the team vulnerable to isolated, workgroup-centric databases that are inconsistent and can’t be integrated. Obviously, no one expects complete coverage in a large organization; however, you should meet with representatives from related departments, as they often share needs for the same core data.
Draft the Enterprise Bus Matrix
The enterprise bus matrix reflects the enterprise’s core business processes or events, in addition to the common dimensional reference data. Both the rows and columns represent cross-departmental requirements. You can learn more about this technique in “The Matrix: Revisited.”
In the simplified bus matrix in Figure 1, the rows identify a subset of the primary business processes within an insurance company. The rows were uncovered while gathering information about the company’s business requirements by asking about strategic business initiatives. The effectiveness of these initiatives is measured by key performance indicators (KPIs) and success metrics, which are collected or generated by the organization’s core business processes, such as underwriting, billing, and payment processing. Typically, a single primary data source supports each business process; the resulting KPIs and metrics from each process are used in a variety of analyses.
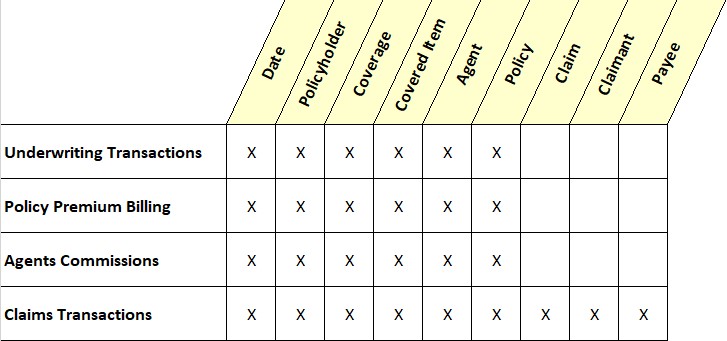
Figure 1: Simplified enterprise data warehouse bus matrix.
The columns are also culled from the requirements gathering sessions. As we explore the business representatives’ decision-making process, we listen for “by” and “where” words to gain insight to natural analytic groupings. For example, business managers may want to look at claims payments by policyholder, agent, and coverage; each represents a core dimension or dimension attribute. Or they may want to analyze payments where the agents have more than five years of experience and work in the Eastern region. By listening to their word choices, we gather clues about dimensions and their attributes.
Drafting the enterprise bus matrix is an iterative process: After each business requirements gathering session, the matrix is fine-tuned to reflect new insights. By the time the requirements process is winding down, we’ve arrived at a surprisingly complete matrix. In fact, when no changes to the matrix are made following a session, we know the requirements process is likely nearing the end.
Prioritize for an Orderly Conclusion
Although teams and their management generally appreciate the need to gather business requirements, they often fail to appreciate the importance of agreeing on priorities. One way to help clarify priorities is to create an “opportunity matrix,” as shown in Figure 2. The rows — as in the bus matrix — list the core processes of the business. But in the opportunity matrix, the columns represent departments or stakeholders rather than common dimensions. Each x in the table indicates which groups are interested in the metrics associated with the business process/event rows. In this manner, the opportunity matrix captures shared data needs and interests across the organization. Keep in mind, however, that focusing on the most frequently requested business process and its metrics doesn’t necessarily translate into the top organizational priority.
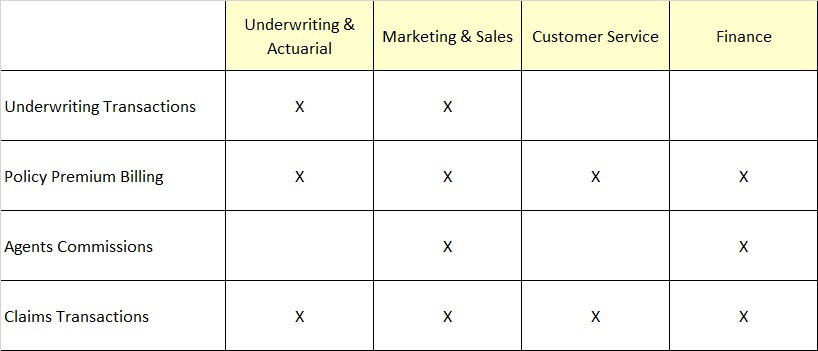
Figure 2: Opportunity matrix.
Once all the requirements have been gathered, a presentation and prioritization session is held with senior management from various departments and workgroups. The session begins with a playback of the requirements findings — typically a major eye-opener for senior management. These managers may have been funding (or trying to fund) their own department-focused analytic data fiefdoms. They’re often unaware of the common information needs across departments in addition to the redundant resources and organizational waste associated with existing departmental solutions.
We then paint the long-term picture of integrated analytic data across the enterprise. Rather than presenting a complex diagram with numerous boxes representing various data stores, we share the enterprise bus matrix (Table 1) with management. It’s a wonderful communication tool to ensure a common vision and understanding without getting mired in technical details.
Each business process row of the matrix represents a project within the overall data warehouse program. As such, we subtly focus the senior managers on manageable (and, we hope, meaningful) project scope boundaries. In an upcoming column, we’ll discuss matrix rows that consolidate data from multiple processes; however, we don’t suggest beginning with these more complex, consolidated processes.
Meanwhile, the dimension columns of the matrix provide the common links between the business processes’ KPIs and success metrics. Senior managers need to understand the importance of common conformed dimensions for consistent business rules, labels, and data. They should also appreciate that regardless of which data warehouse project (matrix row) is selected, resources are required to construct core dimension tables that subsequent iterations of the data warehouse will use.
Once we achieve a common understanding of the current status and desired goals, we then help prioritize the projects. Using the two-by-two grid in Figure 3, we ask business management to evaluate each project based on business value, impact, or importance to the organization. Meanwhile, IT representatives have assessed the feasibility of delivering the business process data. In short, for each row of the matrix, business drives the relative vertical placement, while IT drives the relative horizontal placement on the quadrant.
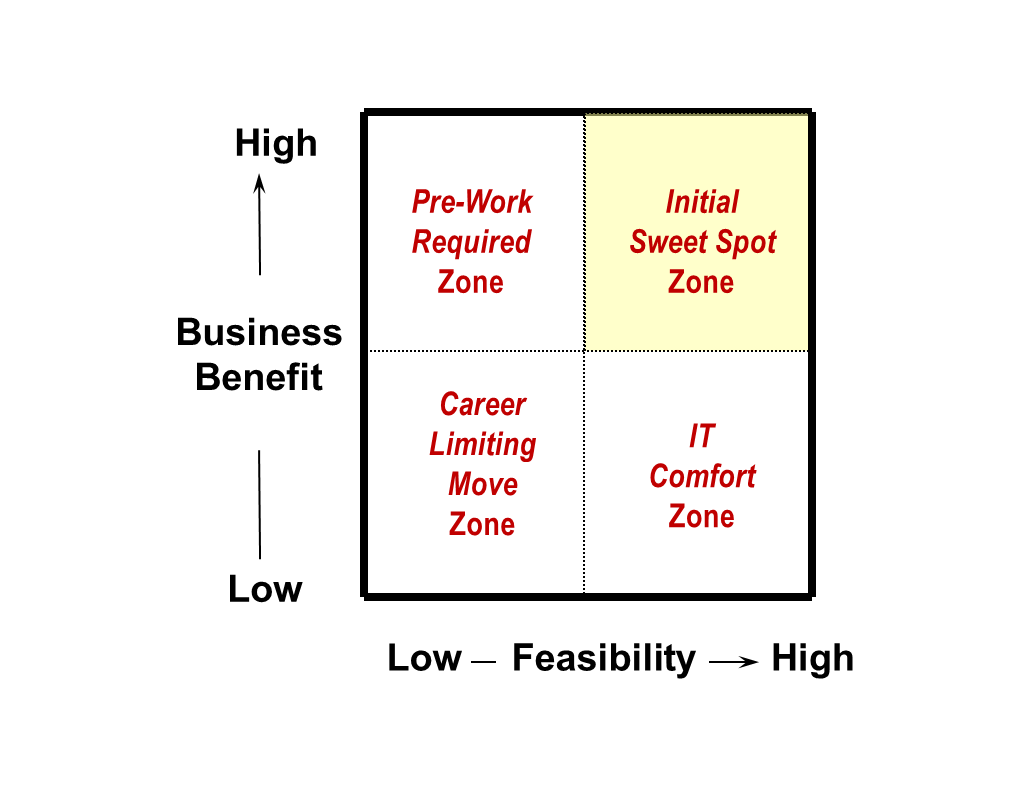
Figure 3: Prioritization grid.
This often highly interactive exercise concludes with projects in each of the four quadrants. Those in the upper-right, sweet spot quadrant in Figure 3 will be tackled individually as part of the initial phases of the data warehouse program. The metrics associated with the projects in the upper-left quadrant are highly important to the business, so IT resources not assigned to the data warehouse should address the feasibility concerns — most likely data issues, such as inadequate or nonexistent data collection systems.
Projects in the lower right comfort zone don’t warrant immediate attention because they’re irrelevant to the business. Finally, those in the avoid zone should fall to the very bottom of the list.
Achieve an Enterprise Roadmap
We’ve been involved in dozens of requirements projects that have culminated in this capstone event. Facilitating these sessions is extremely gratifying because the benefits to both the business and data warehouse project team are so significant. By the conclusion of the meeting, there’s cross-organizational understanding of the present state of the data, a vision for the ultimate long-term enterprise plan, and an agreed-upon roadmap for addressing the gap that’s been prioritized by both the business and IT. What more could you ask for?
Now that we’ve explored our recommended activities and techniques for embarking on a dimensional data-warehousing program with iterative projects, you can see why the bottom-up label is a misnomer. We strongly encourage an enterprise orientation, not just from a data perspective but, more important, from a business point-of-view. Business management buy-in and consensus at this formative stage is critical to the long-term acceptance of the enterprise data warehouse environment.