Dimensional designs often need to accommodate multivalued dimensions. Patients can have multiple diagnoses. Students can have multiple majors. Consumers can have multiple hobbies or interests. Commercial customers can have multiple industry classifications. Employees can have multiple skills or certifications. Products can have multiple optional features. Bank accounts can have multiple customers. The multivalued dimension challenge is a natural and unavoidable cross-industry dilemma.
A common approach for handling multivalued dimensions is to introduce a bridge table. The following figure shows a bridge table to associate multiple customers with an account. In this case, the bridge contains one row for each customer associated with an account. Similarly, a bridge table might have one row for each skill in an employee’s group of skills. Or one row for each option in a bundle of product features. Bridge tables can sit between fact and dimension tables, or alternatively, between a dimension table and its multivalued attributes (such as a customer and their hobbies or interests).
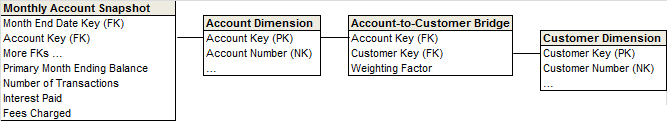
The bridge table is a powerful way to handle dimensions that take on multiple values when associated with the grain of a fact table’s measurement event. It’s both scalable and flexible to handle an open ended number of values. For example, you can easily associate many diagnoses with a patient’s hospital stay, and new diagnoses are easily accommodated without altering the database design. However, bridge tables have their downsides. Ease of use is often compromised, especially since some BI tools struggle to generate SQL that successfully crosses over the bridge. Another unwanted outcome is the potential over-counting that occurs when grouping by the multivalued dimension as a single fact row’s performance metrics can be associated with multiple dimension rows unless an allocation/weighting factor is assigned to each row in the bridge table.
Here are several potential techniques to avoid bridge tables. However, be aware that each comes with its own potential downsides, too.
1. Alter the fact table’s grain to resolve the many-valued dimension relationship, allocating the metrics accordingly.
Many-to-many relationships are typically best resolved in fact tables. For example, if multiple representatives are associated with a sales transaction, you might be able to declare the fact table’s grain to be one row per rep per sales transaction, and then allocate the sales quantity and dollars to each row. While a more natural grain might be one row per sales transaction, the subdivided grain may seem logical to the business users in this scenario. In other situations, a subdivided grain would be nonsensical. For example, if you need to represent the customers’ multivalued hobbies, it wouldn’t make sense to declare the grain to be one row per customer hobby per sales transaction. That’s an unnatural grain!
2. Designate a “primary” value.
Declaring a primary diagnosis, primary account holder, primary major, etc. with either a single foreign key in the fact table or single attribute in the dimension table eliminates the multivalued challenge. In this scenario, all the attribute column names would be prefaced with “primary.” Of course, coming up with the business rules to determine the primary relationship may be impossible. And subsequent analyses based solely on the primary relationship will be incomplete and/or misleading as the other multivalued dimensions and their attributes are ignored.
3. Add multiple named attributes to the dimension table.
For example, if you sold pet supplies, you might include flags in the customer dimension to designate dog buyers, cat buyers, bird buyers, etc. We’re not suggesting that you include ten generically-labeled columns, such as animal buyer 1, animal buyer 2, etc. The named attribute positional design is attractive because it’s easy to query in virtually any BI tool with excellent, predictable query performance. However, it’s only appropriate for a fixed, limited number of options. You wouldn’t want to include 150 distinct columns in a student dimension, such as art history major, for each possible major at a university. This approach isn’t very scalable, plus new values require altering the table.
4. Add a single concatenated text string with delimited attribute values to the dimension.
For example, if courses can be dual taught, you might concatenate the instructors’ names into a single attribute, such as |MRoss|RKimball|. You’d need a delimiter such as a backlash or vertical bar at the beginning of the string and after each value. This approach allows the concatenated value to be easily displayed in an analysis. But there are obvious downsides. Queries would need to do a wildcard search with contains/like which are notoriously slow performing. There may be ambiguity surrounding upper and lower case values in the concatenated string. It wouldn’t be appropriate for a lengthy list of attributes. Finally, you can’t readily count/sum by one of the concatenated values or group/filter by associated attributes, such as the instructors’ tenure status.
Multivalued dimension attributes are a reality for many designers. The bridge table technique and the alternatives discussed in this Design Tip have their pluses and minuses. There’s no single right strategy; you’ll need to determine which compromises you can live with. Finally, these techniques are not mutually exclusive. For example, dimensional models often include a “primary” dimension with a single foreign key in the fact table, coupled with a bridge table to represent the multivalued dimensions.